Digital Analytics Project: LA Times
- bellactliu
- Sep 6, 2023
- 4 min read
Updated: Oct 3, 2023
Making observation and analysis on LA times website's data using Google sheets. Organized What, Why, What Next, Who, and How, to provide insights and suggestions for future actions.

1. WHAT
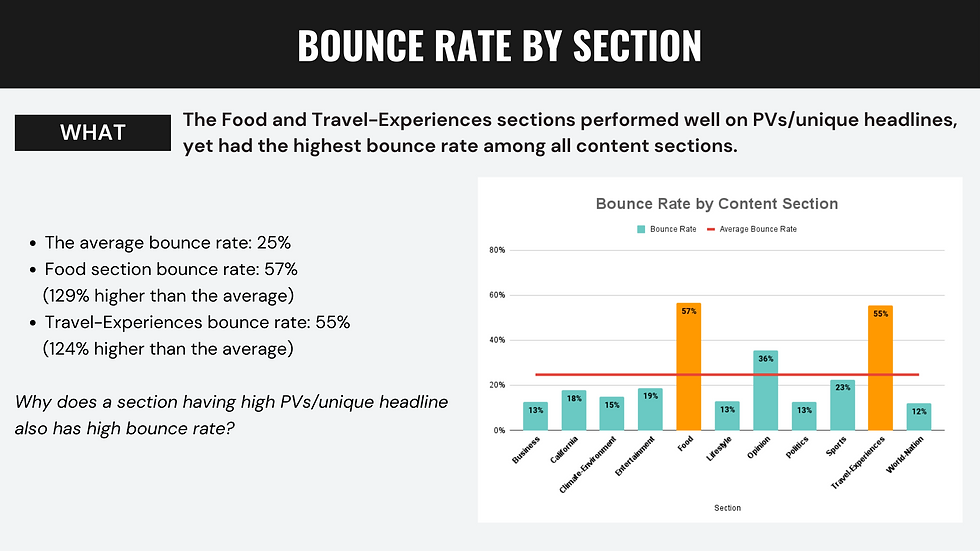
Looking through the bounce rate for all content sections, the average bounce rate was 25%. However, there were 2 sections having much higher bounce rate than the average. The Food section had the highest bounce rate of 57%, which was 129% higher than the average bounce rate; the Travel-Experiences comes next, with the bounce rate of 55%, and it was 124% higher than the average.
On the other hand, when we analyzed the PVs per unique headline in the Food section,it actually had the highest PVs/unique headline. The situation was similar in the Travel-Experiences section. It is interesting to research why a section having high PVs/unique headlines also had a high bounce rate.
2. WHY

There might be 3 main reasons for high PVs/unique headline yet high bounce rate of the Food section and Travel-Experiences section:
1. The attribute of the sections/headlines: The Food and Travel-Experiences sections might have enticing headlines that attracted a large number of readers, hence the high PVs/unique headline. People might be curious about new restaurants, recipes , or tourist spots recommendations. However, once they visited the page and found the specific information they were seeking, they might not explore further and left the website, resulting in a high bounce rate.
2. Higher bounce rate of mobile phone: Based on Chart 2, 71% of the audience accessed the Food section and 74% accessed the Travel-Experiences section from mobile phones, which was relatively higher than other sections. In addition, mobile phone users had the highest bounce rate of 44% among three types of devices. Therefore, the high bounce rate meant mobile phone users might receive the link of articles recommending restaurants or tourist spots via social media or messages, they scanned through the one article, and they left the website to continue what they were doing previously.
3. The length of the articles: Since most of the audience used mobile phones to browse the two sections, when an article had great length, it might increase bounce rate because it was exhausting to read long articles via mobile phones. In Los Angeles Times, the articles in Food and Travel-Experiences sections are usually in the form of long lists, such as “38 Classic Mexican Restaurants Essential to Los Angeles,” “The 65 Best Bookstores in L.A,” and even “These are the 101 best restaurants in Los Angeles.” The readers might only read part of the article and left, or left the website because they got tired from reading the whole article.
3. WHAT NEXT
Based on the 3 Whys, in order to improve the high bounce rate of the two sections, we could consider the following steps:
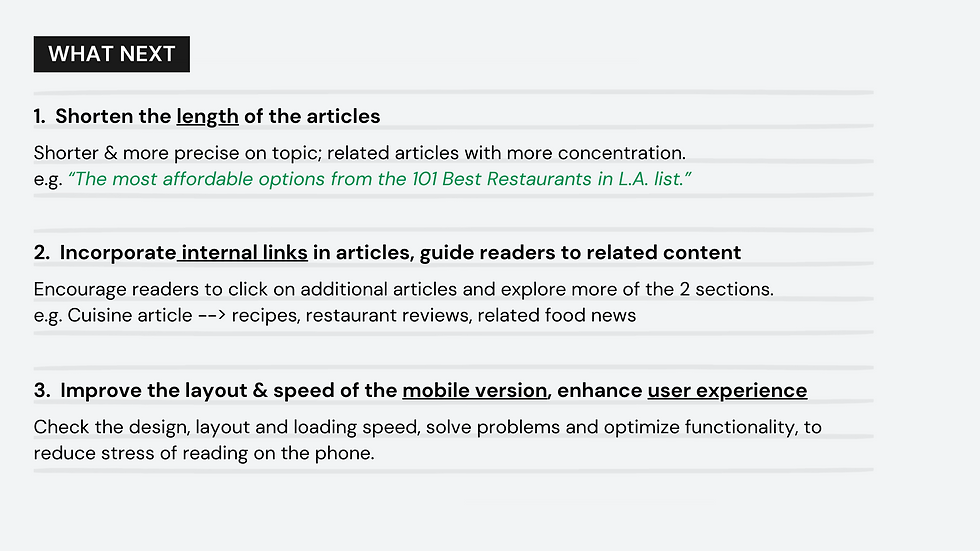
1. Shorten the length of the articles. The long articles might decrease the willingness of readers to continue reading others. Thus, consider making the articles shorter and more precise on the topic; or posting related articles with more concentration. Luckily, Los Angeles Times has been working on the improvement. For example, it posted articles like “I’m Visiting All 600 LA Spots on the National Register. Here are 10 You can’t Miss,” or “The most affordable options from the 101 Best Restaurants in L.A. list.”
2. Incorporate internal links within articles to guide readers to related content. This can encourage readers to click on additional articles and explore more of the Food and Travel-Experiences sections, thereby reducing the bounce rate. For example, a cuisine article could link to recipes, restaurant reviews, or related food news; an article of best national parks list could link to detailed guides of individual national parks, or articles on hiking tips.
3. Improve the layout of the mobile version, enhance user experience. When the stress of reading via mobile phone is eased, the chance for readers to read more articles may increase. Check the design, layout and loading speed of the sections in mobile mode, solve possible problems and optimize the overall functionality.
4. WHO & HOW

To work on the actions above, consult editorial, UX/UI, and technical Teams.
1. Editorial Team: The editorial team can improve article quality by adjusting the length of content, adding internal links to related articles, and they will continue providing trending articles to attract the audience to read more for the Food and Travel-Experiences sections.
2. UX/UI Team: The UX/UI team can optimize the overall look of the two sections. They can work on improving the website's design, layout, and navigation to enhance user experience and make it more appealing and user-friendly.
3. Technical Team: The technical team can help implement technical changes to the website. They can optimize page load times, ensure proper functioning of internal linking features, and address any technical issues especially on mobile version.
The bounce rate is the primary metric to measure, for it is the main issue to solve for the two sections. The secondary metric could be the average time on the two sections, which could provide insight on readers’ level of engagement. Below are the signs of success to achieve for these two metrics.
1. Decrease bounce rate: Seeking for a decrease in bounce rate of mobile phone, and in bounce rate of the Food and Travel-Experiences sections. This will indicate that readers are engaging more with the content and exploring multiple articles within the sections.
2. Increase the average time on the sections: An increase in the average time on each of the two sections suggests that readers are spending more time browsing, they may have higher engagement and interest to read more articles or pages.


Comments